MarS-Doc
MARkdown to Slide with panDOC — Slides as Code
RAYA Christian
2026
Introduction
Welcome to MarS-Doc
MarS-Doc (Markdown to Slide with panDoc)
This tool is a presentation system designed for engineers, developers, and scientists.
It solves the chronic problems of traditional presentations:
- 🔀 Version control — Plain text files readable by Git.
- 🎨 Content vs. Form separation — You write the content, the engine handles the style.
- 🔒 Independence — Generate self-contained or connected HTML archives.
“If it’s not in version control, it doesn’t exist.”
System Requirements
To build this project locally, ensure your environment meets the following specifications:
- Pandoc 3.8.+ : Required for advanced AST manipulation and latest Reveal.js template support.
- GNU Make: Used to automate the build process, asset synchronization, and dual-target generation (Online/Offline).
- Browser-Sync: Allows you to automatically update your slide as you edit it.
(source)"] B["slides.html
(artifact)"] C["Reveal.js
(runtime)"] %% Connexions horizontales A -- "pandoc" --> B B -- "browser" --> C
Build Pipeline
make Commands
# Generate both versions
make

# CDN-dependent version
make online

# Self-contained version
make offline

# Live-reload
make watch
Two distribution modes:
- Online (
slides_online.html): Uses CDNs for Reveal.js, ECharts, etc. Ideal for keeping the Git repository lightweight. - Offline (
slides_offline.html): Embeds the LUA/JS runtime and fonts locally. Perfect for conferences without a reliable internet connection.
Presenter Tools
The Intuitive Toolbar
Look at the bottom left of your screen: a small gear wheel (⚙️) gives you access to a retractable toolbar containing essential functions:
- ⛶ Toggle Fullscreen: Enable/disable fullscreen mode.
- 📱 Remote Control: Displays the WebSocket QR Code.
- ⏱️ Timer: Displays the presentation stopwatch.
- 🖨️ PDF Print: Launches a clean export of the presentation.
- ⊞ Overview (O): Zooms out to see all slides at a glance.
- ✏️ Pen (C): Annotate directly on the current slide.
- 🂠 Chalkboard (B): Opens an interactive chalkboard.
- 🧽 Eraser: Clears your annotations.
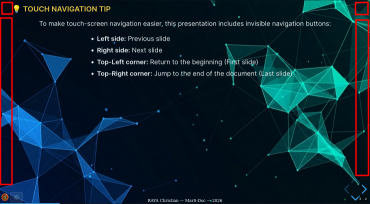
💡 Touch Navigation Tip
To make touch-screen navigation easier, this presentation includes invisible navigation buttons:
- Left side: Previous slide
- Right side: Next slide
- Top-Left corner: Return to the beginning (First slide)
- Top-Right corner: Jump to the end of the document (Last slide)
Smartphone Remote (WebSocket)
Forget capricious USB clickers.
- Click the 📱 icon in the bottom left toolbar.
- A QR Code appears on the right side of the screen.
- Scan it with your smartphone.
- Your phone becomes an instant remote control (Next, Prev, Start, End) connected via WebSocket.
No app to install, everything happens directly in your phone’s browser.
Time Management (Timer)
Markdown Syntax
To define the time allocated to a slide (in seconds), insert this comment anywhere in the section:
<!-- timing: 10 -->
How it works
- The global timer (bottom right) activates on the first slide change.
- It automatically calculates the expected cumulative time.
- The colored dot indicates your pacing:
- 🟢 Green: On time or ahead.
- 🟠 Orange: Slightly behind.
- 🔴 Red: > 10 seconds behind.
Layouts & Components
Multi-Column Layout
Image 1
![]()
Column 1
Image 2
![]()
Column 2
Image 3
![]()
Column 3
Image 4
![]()
Column 4
Image 5
![]()
Column 5
Custom Grids and Rows
Use the .rows-full classe combined with background
colors (.bg-blue, .bg-yellow, width=30%,
height=35%, etc.) to structure space without writing any HTML:
.bg-green .rounded-tl
.bg-red .rounded-bl
.bg-orange .rounded-tr
.bg-black .rounded-br
Custom Grids and Columns
Use the .cols-full classe combined with background
colors (.bg-blue, .bg-yellow, width=25%,
height=30%, etc.) to structure space without writing any HTML:
.bg-green .rounded-tl
.bg-orange
.bg-black .rounded-tr
.bg-green .rounded-bl
.bg-orange
.bg-black .rounded-br
Alpine.js: Alerts & Toggles
The .warning and .info classes
automatically generate semantic callouts.
⚠️ Warning: This is a critical alert generated by LUA + Alpine.js.
ℹ️ Information: The toggle component hides text to avoid cluttering the slide.
The Stepper (Guided Workflow)
- Write: Author your content in plain Markdown.
- Compile: Run
make onlineormake offline. - Present: Open the generated file in any modern browser.
- Control: Scan the QR Code to navigate via your mobile device.
Data-Viz & Diagrams
CSV File Import
The LUA script directly reads your .csv files and
generates the appropriate Pandoc tables on the fly.
| Composant | Boîtier | Fonction principale | Statut |
|---|---|---|---|
| LFCN-80+ | FV1206 |
Filtre Passe-Bas (DC - 80 MHz); Tolérance serrée | Validé |
| GALI-39+ | SOT-89 |
Amplificateur RF gain élevé (20 dB @ 1 GHz) | En test |
| BAT15-04W | SOT-323 |
Diode Schottky pour détection de puissance RF | À valider |
{.csv src="assets/table.csv" sep=";" header="true" align="l,c,l,r" limit=3}
- The default separator is ; but you can specified de separator with sep=“;”
- You can display only the first N rows using the ‘limit’ parameter
- You can control the alignment of the columns using the ‘align’ parameter
Image zoom
![]()
Double click on the image to view it in full screen
ECharts: JSON Charts
ECharts: SNP Files
Directly reading your RF data files (.s2p, .s3p, .s4p).
S2P Smith Chart
Plot magnitude in dB
ECharts: SNP Files
Directly reading your RF data files (.s2p, .s3p, .s4p).
S2P Polar Chart
Plot magnitude in linear
ECharts: Gnuplot conversion to echarts.js
Convert Gnuplot scripts (.gnu) in echarts graph.
Polar S-parameters from Gnuplot
XY Gnuplot Script
ECharts: Gnuplot conversion to echarts.js histogram
Convert Gnuplot scripts (.gnu) in echarts graph.
Histogram from Gnuplot
Histogram with Gaussian function from Gnuplot
WaveDrom - Diagrams
Wavedrom in markdown
Support of WaveDrom diagrams
WaveDrom - External File
Include WaveDrom: ./assets/wavedrom.json
Wavedrom in markdown
Support of WaveDrom symbols
Mermaid Diagrams
2D Navigation Model
Reveal.js organises slides on a 2D grid:
| Direction | Key | Meaning in this deck |
|---|---|---|
| → Right | → |
Next thematic section |
| ↓ Down | ↓ |
Deeper technical detail |
| ← Left | ← |
Previous section |
| ↑ Up | ↑ |
Previous slide (same section) |
Tip: press
Ofor the Overview to visualise the full grid at a glance.
Essential Keyboard Shortcuts
| Key | Mode | Description |
|---|---|---|
S |
Speaker | Opens speaker view with notes + timer |
O |
Overview | Full 2D grid of all slides |
F |
Fullscreen | Hides browser chrome |
B |
Blackout | Black screen — refocuses audience |
V |
Pause | Pause without leaving the slide |
G |
Jump | Jump directly to a slide number |
P |
Previous | Previous slide |
N |
Next | Next slide |
M |
Menu | Table of Contents |
Esc |
Back | Exits current mode |
Visual Features
Fragments — Step-by-Step Reveal
The most useful fragment classes in practice:
.fade-in— soft appearance (default).fade-in-then-out— appears, then disappears on next click.highlight-red— red highlight without shifting layout.highlight-current-blue— blue on active item, grey on others.fade-out— gradual disappearance
Advanced Sequencing with data-fragment-index
[Text]{.fragment .fade-in data-fragment-index=1}Live demonstration — multiple elements share the same index:
- 🔵 Object A — visible between click 1 and click 3
- 🟢 Object B — appears at click 2
🔴 Object C —
grow at click 3, exactly when A disappears
Per-Slide Dynamic Backgrounds
Each slide can declare its own background:
| Attribute | Example |
|---|---|
data-background-color |
"#1a1a2e" |
data-background-image |
"./assets/bg.png" |
data-background-video |
"./assets/loop.mp4" |
data-background-iframe |
"https://example.com" |
data-background-gradient |
"linear-gradient(...)" |
Pandoc syntax — inline attribute on the heading:
## My Section {data-background-color="#1a1a2e"}Code & Mathematics
Progressive Syntax Highlighting
Thanks to highlight.js and the
fix-highlight.lua script, you can animate code line by
line.
def demo_pipeline():
    print("🚀 Initializing MarS-Doc...")

    tools = ["Pandoc", "Reveal.js", "ECharts", "Mermaid", "Alpine.js"]
    for tool in tools:
        print(f"  ✅ Loading: {tool}")
data-line-numbers="all|1-2|4|5-6"- “all” : all lines highlighted on first click
- “1-2” : lines 1 and 2 on second click
- “4” : line 4 on third click
- “5-6” : lines 5 and 6 on fourth click
MathJax Equations
Native LaTeX rendering is enabled via the --mathjax
flag:
Schrödinger equation:
\[i\hbar\frac{\partial}{\partial t} \Psi(\mathbf{r},t) = \hat{H} \Psi(\mathbf{r},t)\]
Fourier transform:
\[\hat{f}(\xi) = \int_{-\infty}^{\infty} f(x)\ e^{-2\pi i x \xi}\,dx\]
End of presentation
Ready to compile!
Your complete, versionable, and interactive presentation environment is now operational.
Useful links: